Report generation
ImmuneSIM includes a pdf plot generation tool for quick analysis of the output including comparison to a reference repertoire with respect to:
- Length distribution
- VDJ usage
- Positional amino acid frequency
- Gapped k-mer frequency
Following the simulation of a repertoire as discussed in Quickstart guide the in-silico data can thus be analyzed easily. There are two modes ‘single repertoire’ or ‘comparative’. These functions generate and output plots using the ggplot2 [1] and other R packages for aesthetics including: ggthemes [2], ComplexHeatmap [3], circlize [4], RColorBrewer [5] and theme.akbar [6]
Single repertoire
Generates pdf plots of full VDJ length distribution, positional amino acid frequency of most common lengths and VDJ usage plots of generated repertoire. (See: Output plotting function)
    sim_repertoire <- immuneSIM(number_of_seqs = 100,
                                            species = "mm",
                                            receptor = "ig",
                                            chain = "h",
                                            verbose = TRUE)

plot_report_repertoire(sim_repertoire, output_dir = "my_directory/")
Comparative
Outputs pdf plots comparing two repertoires chosen by the user with respect to length distribution, vdj usage, amino acid frequencies, gapped k-mer occurrence.
    repertoire_A <- immuneSIM(number_of_seqs = 100,
                                            species = "mm",
                                            receptor = "ig",
                                            chain = "h",
                                            verbose = TRUE)

    repertoire_B <- immuneSIM(number_of_seqs = 100,
                                    species = "mm",
                                    receptor = "ig",
                                    chain = "h",
                                    verbose = TRUE)

    #Note: you need to specify your output directory.
plot_repertoire_A_vs_B(
    repertoire_A,
    repertoire_B,
    names_repertoires = c("Sim_repertoire_1","Sim_repertoire_2"),
    length_aa_plot = 14,
    output_dir = "my_directory/"
    )
Length distribution (amino acid)
The length distribution of amino acid CDR3 sequences is calculated for both repertoires and output as a barplot.
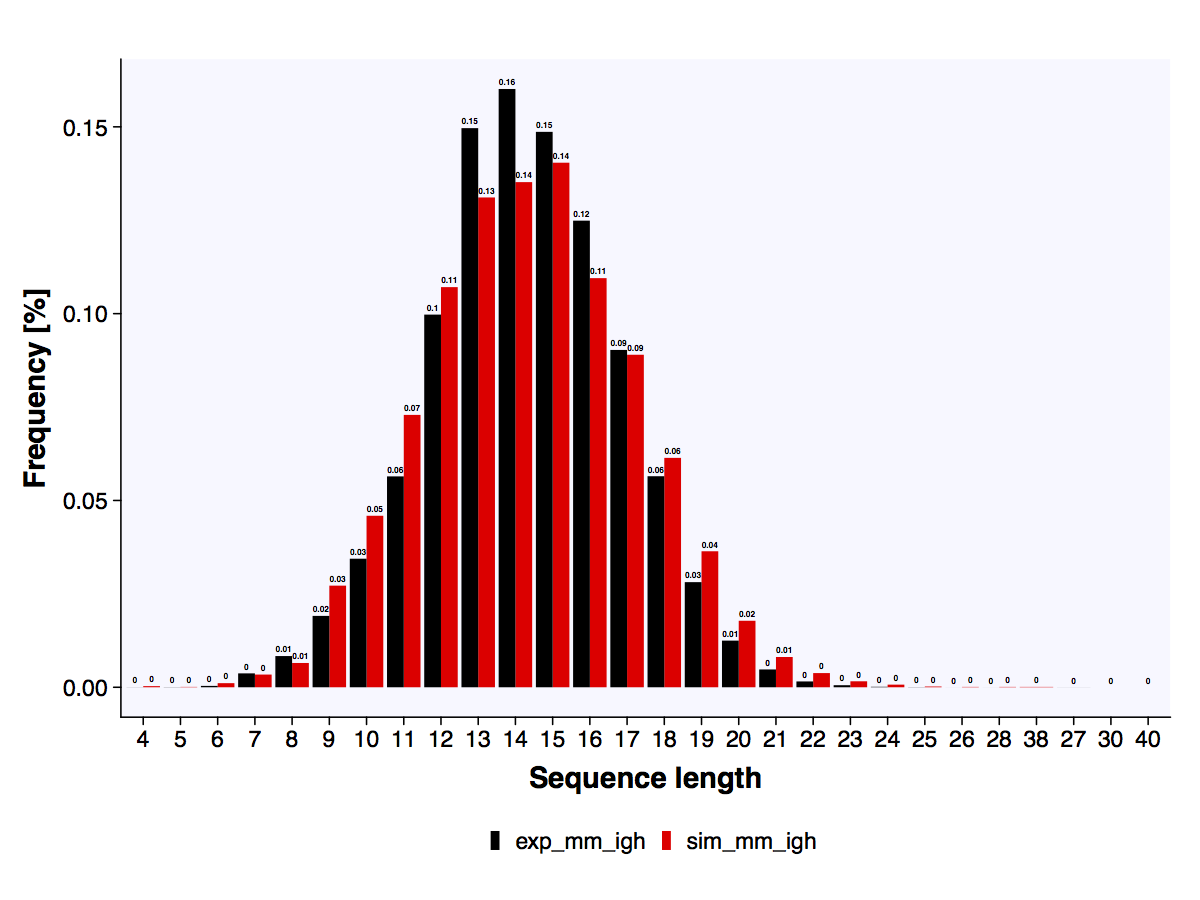
The length distribution of the reference experimental and simulated datasets.
VDJ usage
VDJ usage checks the usage of V, D and J genes (based on IMGT [7]) between the generated and reference repertoires and outputs and XY plot including Pearson and Spearman correlation measure.
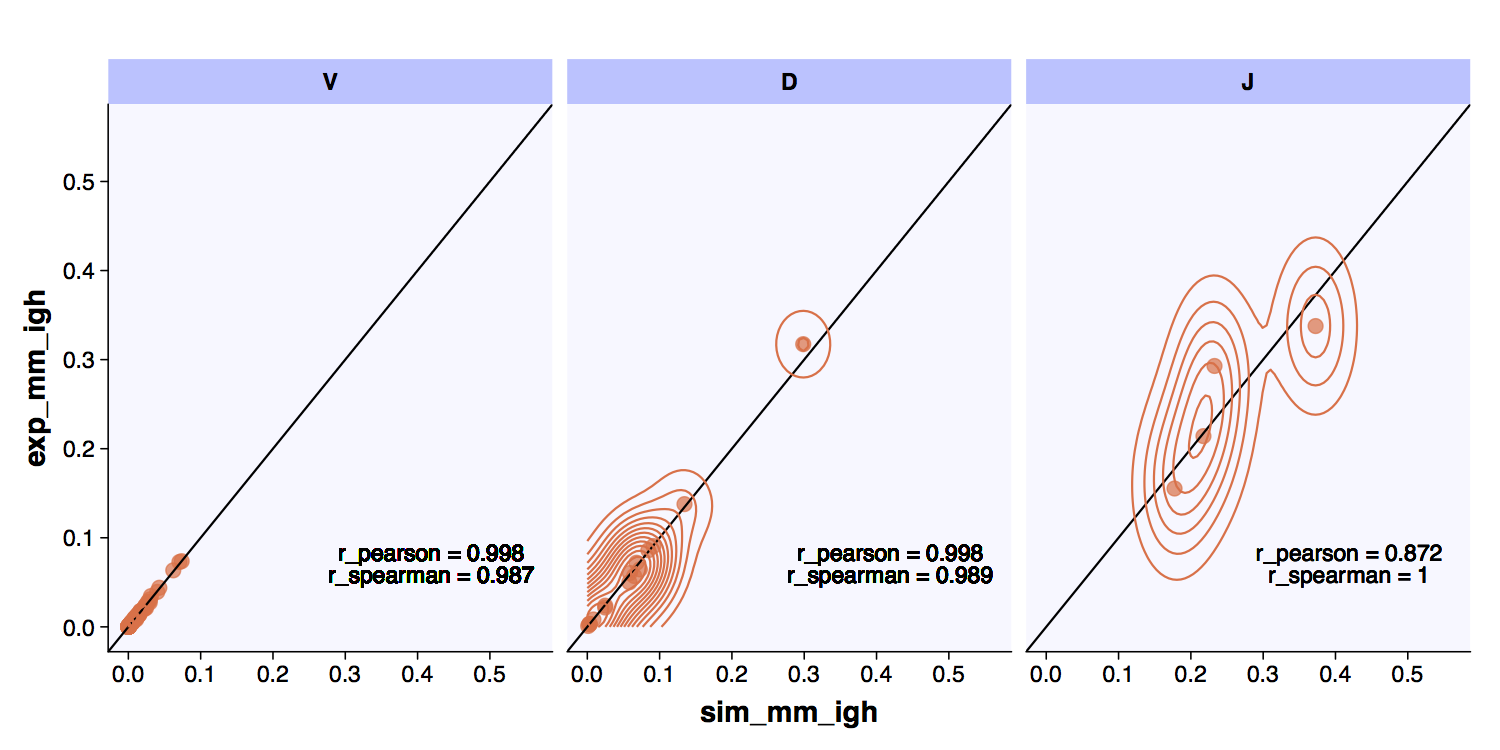
The VDJ usage comparison between an experimental repertoire and a standard simulation have high correlation..
Positional amino acid frequency
Amino acid frequency calculates positional amino acid frequency in the CDR3 of the generated sequences. Output stacked bar plots including mean MSE (mmse) [8] versus reference across all positions.
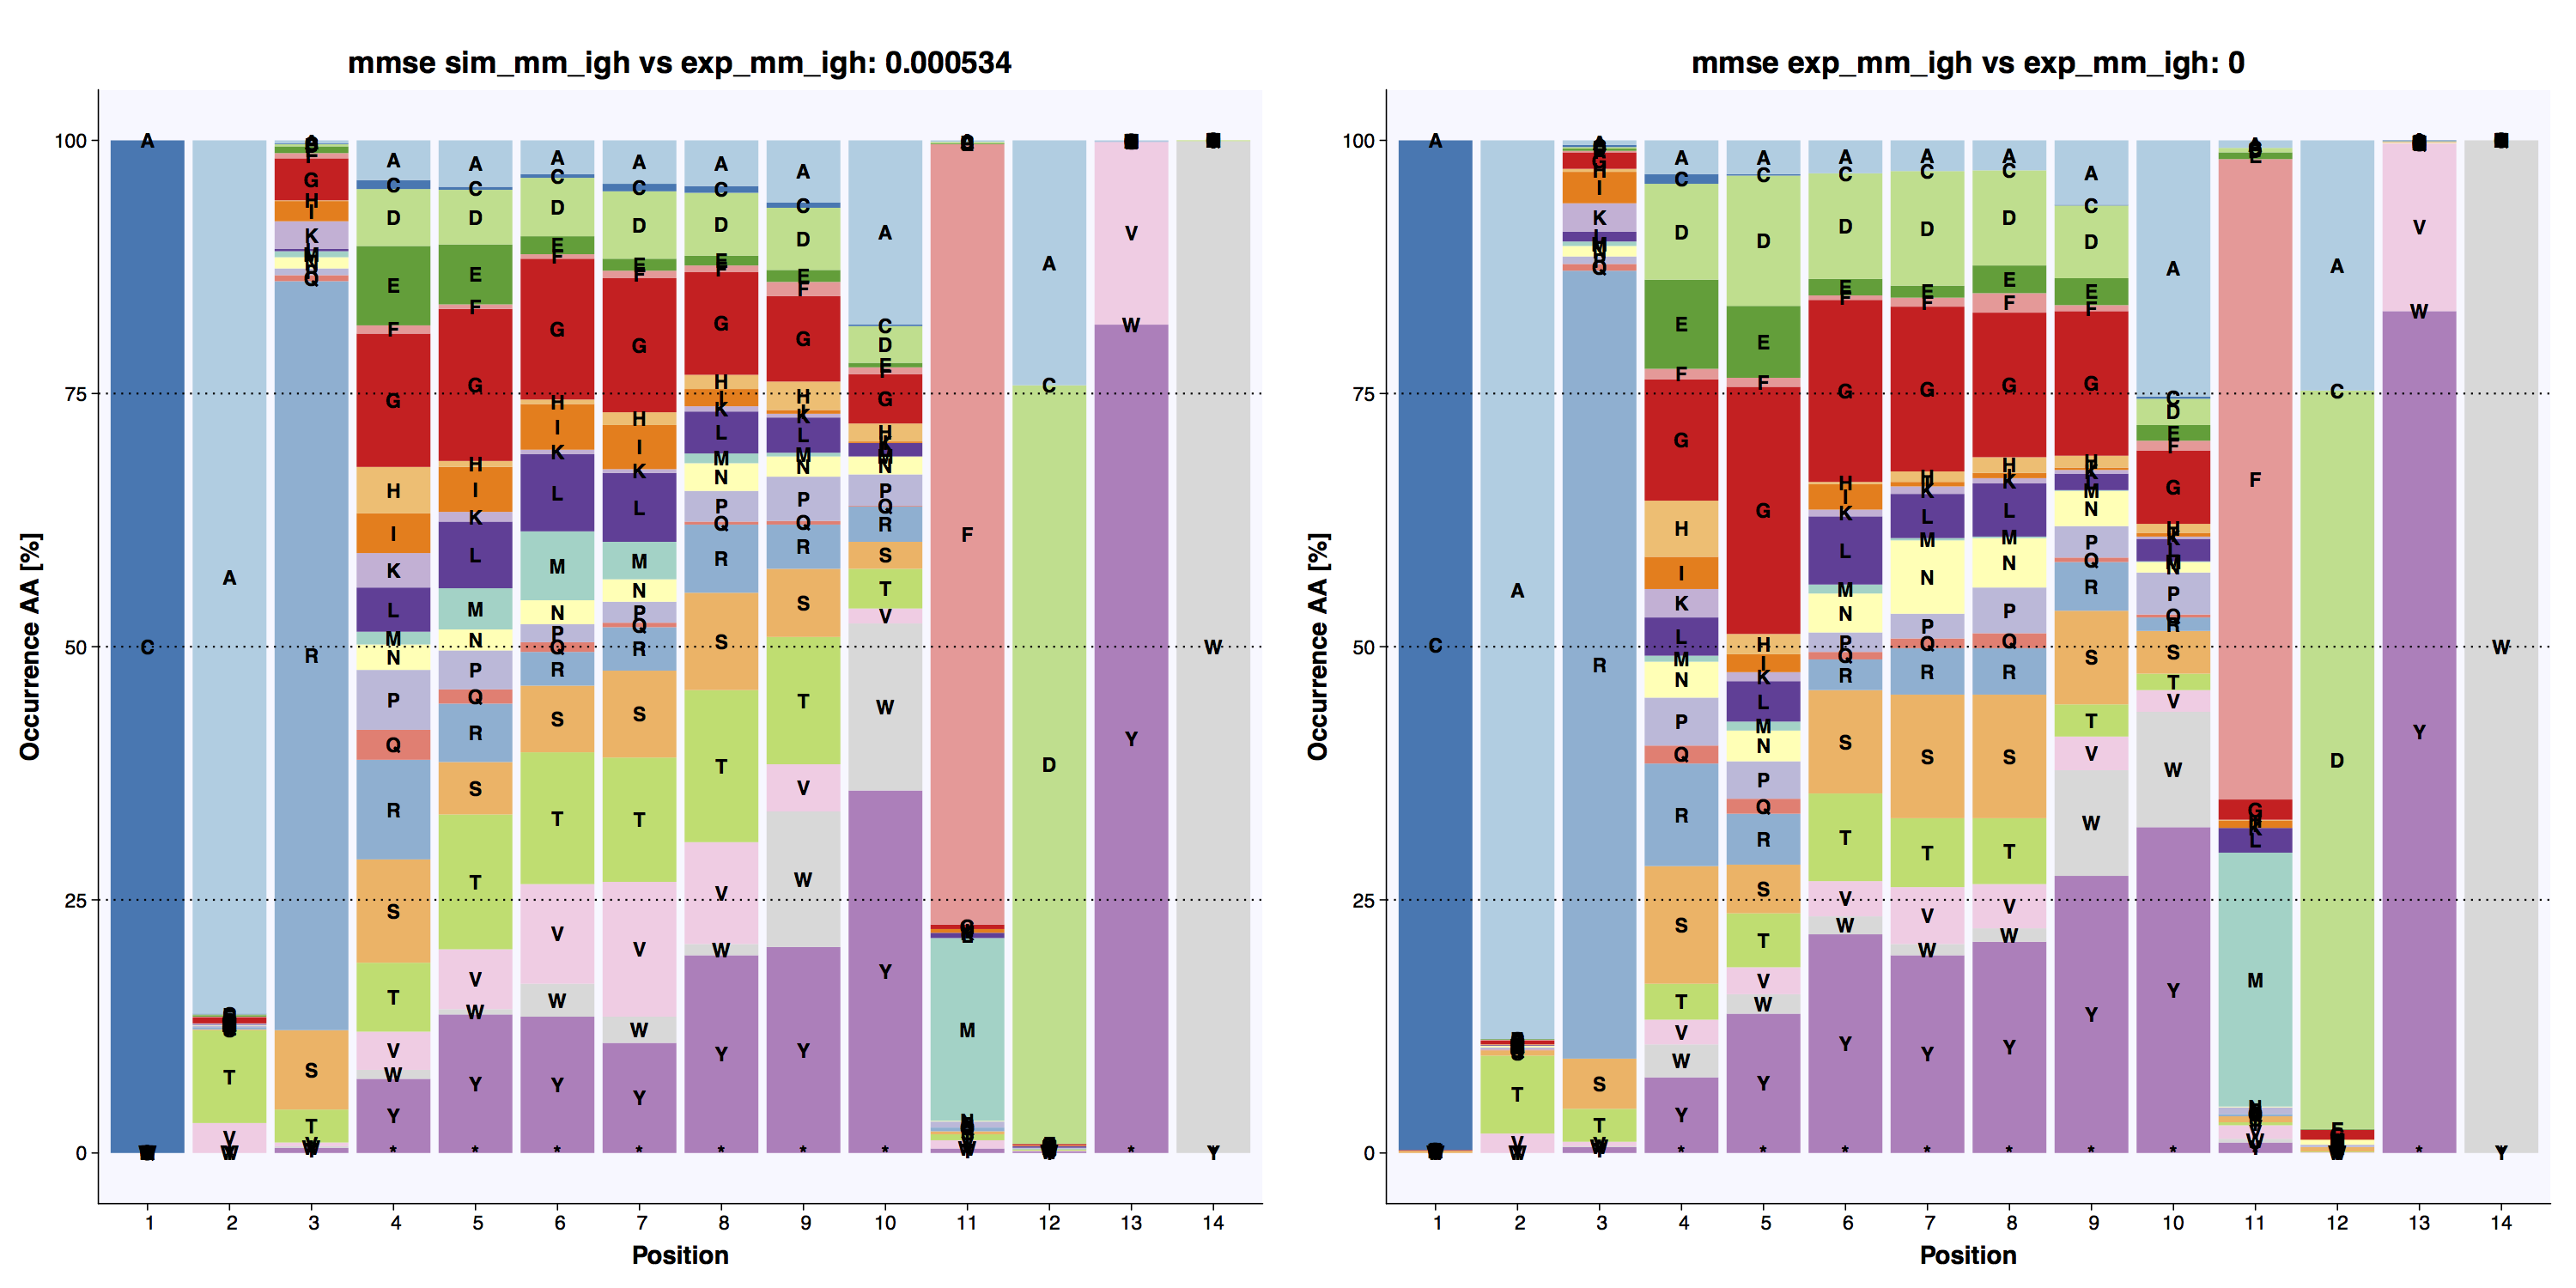
The positional amino acid frequencies in the experimental and simulated datasets are highly similar.
Gapped k-mer frequency
Gapped k-mer frequency counts the occurrence of gapped k-mers in the CDR.3 of the generated sequences. Gapped k-mers are subsequences of two k-mers separated by a gap of length up to a defined variable m. For the plot generation the gapped k-mers frequencies of the nucleotide sequences for k = 3, m ≤ 3 are evaluated.
Unlike the Positional amino acid frequency the gapped k-mers contain sequential information allowing the user to assess the similarity of sequence patterns across simulated repertories in an XY-plot.
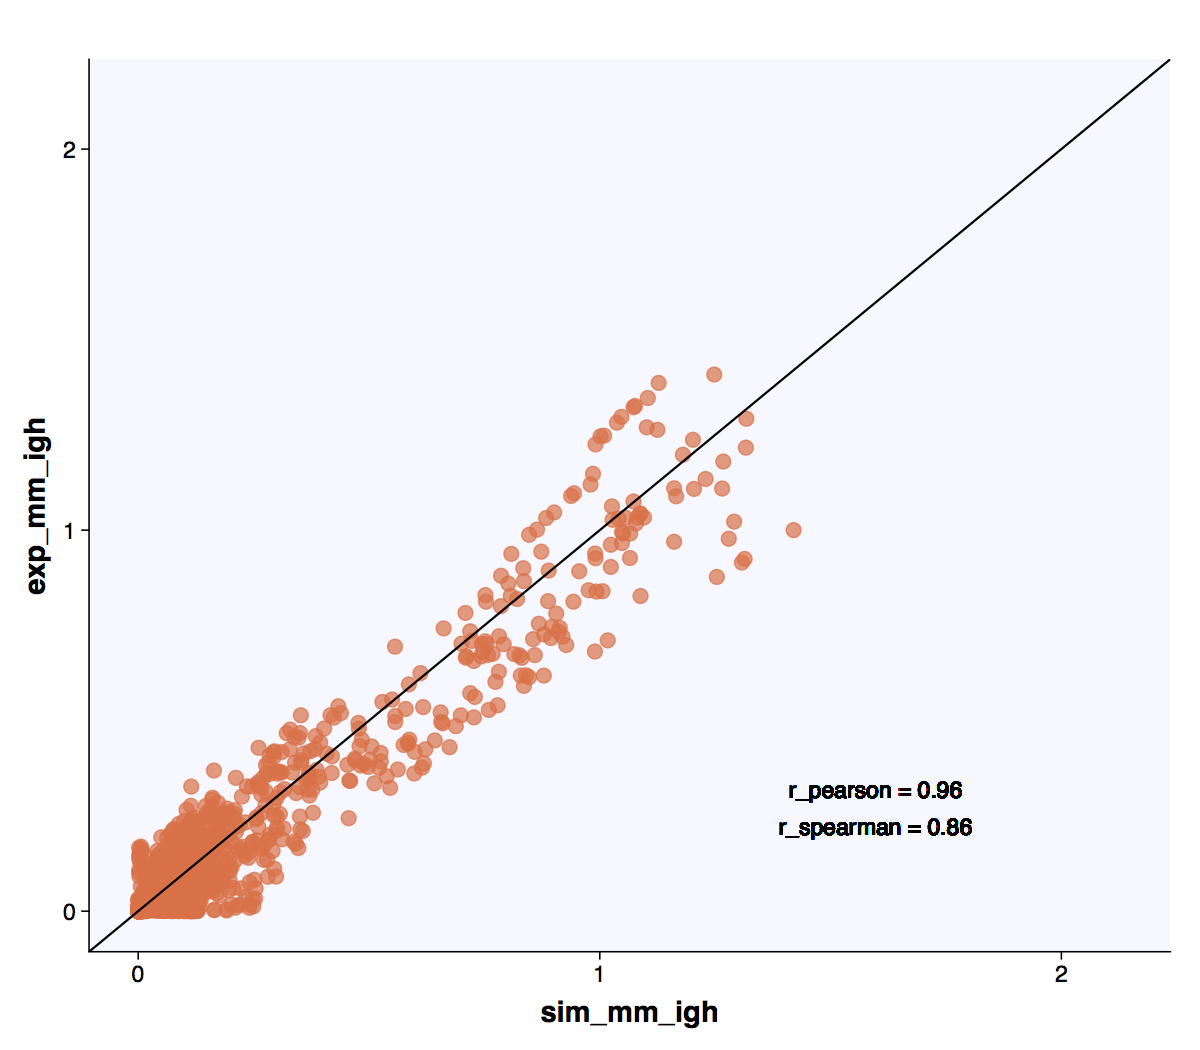
Experimental (murine naive B-cell repertoire [9]) and standard simulation repertoires have high correlation with respect to the occurrence of gapped k-mer patterns.
| [1] | ggplot2: https://ggplot2.tidyverse.org |
| [2] | ggthemes: https://CRAN.R-project.org/package=ggthemes |
| [3] | ComplexHeatmap: https://bioconductor.org/packages/release/bioc/html/ComplexHeatmap.html |
| [4] | circlize: https://CRAN.R-project.org/package=circlize |
| [5] | RColorBrewer: https://CRAN.R-project.org/package=RColorBrewer |
| [6] | theme.akbar: https://doi.org/10.5281/zenodo.3362026 |
| [7] | IMGT, the international ImMunoGeneTics database. Lefranc et al., Nucleic Acids Research, 27(1), 1999, https://academic.oup.com/nar/article/27/1/209/1234872 |
| [8] | High-throughput antibody engineering in mammalian cells by CRISPR/Cas9-mediated homology-directed mutagenesis, Mason et al., Nucleic Acids Research, 46(14), 2018, https://academic.oup.com/nar/article/46/14/7436/5042025 |
| [9] | Systems Analysis Reveals High Genetic and Antigen-Driven Predetermination of Antibody Repertoires throughout B Cell Development, Greiff et al., Cell Reports, 19(7), 2017, https://www.sciencedirect.com/science/article/pii/S221112471730565X |